Установка и настройка Prometheus. Проксирование Prometheus и node_exporter.
Требуется мониторить состояние хоста, а также экземпляр PostgreSQL на этом же хосте.
Установка Prometeus и exporter`ов:
# apt-get install prometheus prometheus-cpp-dev prometheus-postgres-exporter
Prometheus будет жить за реверс-прокси, слушать только localhost и использовать Basic auth .
Для реализации данных функций в файл /etc/default/prometheus добавляю строку:
ARGS="--web.listen-address=127.0.0.1:9090 --web.config.file /etc/prometheus/web.yml"
Используя, функцию htpasswd , генерирую пароль для пользователя admin:
# htpasswd -nBC 16 admin | tr -d ':\n'
New password: admin
Re-type new password: admin
admin$2y$16$JBE7kO5H1UrY5IkiXcilFer5jUOQ9JllUZg.NT9g8olyZaY5QLABS
Пароль помещаю в файл /etc/prometheus/web.yml:
basic_auth_users:
  admin: $2y$16$JBE7kO5H1UrY5IkiXcilFer5jUOQ9JllUZg.NT9g8olyZaY5QLABS
Далее настраиваю работу node_exporter.
# mkdir -p /etc/node_exporter/
# touch /etc/node_exporter/web.yml
В файл /etc/node_exporter/web.yml помещаю секцию:
basic_auth_users:
  admin: $2y$16$JBE7kO5H1UrY5IkiXcilFer5jUOQ9JllUZg.NT9g8olyZaY5QLABS
Можно использовать другой логин/пароль , но тогда потребуется корректировка секции scrape_config файла /etc/prometheus/prometheus.yml, пример которого приводится ниже.
В файл /etc/default/prometheus-node-exporter добавляю:
ARGS="--web.listen-address=127.0.0.1:9100 --web.config.file /etc/node_exporter/web.yml"
В файле /etc/prometheus/prometheus.yml секцию scrape_configs привожу к виду:
scrape_configs:
  # The job name is added as a label `job=<job_name>` to any timeseries scraped from this config.
  - job_name: 'prometheus'

    # Override the global default and scrape targets from this job every 5 seconds.
    scrape_interval: 5s
    scrape_timeout: 5s

    # metrics_path defaults to '/metrics'
    # scheme defaults to 'http'.
    basic_auth:
      username: admin
      password: admin

    static_configs:
      - targets: ['localhost:9090']

  - job_name: node
    # If prometheus-node-exporter is installed, grab stats about the local
    # machine by default.
    basic_auth:
      username: admin
      password: admin
    static_configs:
      - targets: ['localhost:9100']
Выполняю рестарт сервисов:
# systemctl restart prometheus
# systemctl restart prometheus-node-exporter
Проверяю состояние:
# systemctl restart prometheus
# systemctl restart prometheus-node-exporter
Случилось так, что в качестве реверс-прокси пришлось использовать Apache. Файл конфигурации для виртуального хоста выглядит следующим образом:
<VirtualHost *:443>
	ServerName prometheus.sysad.su

	ServerAdmin webmaster@localhost
	DocumentRoot /var/www/html

        ProxyPreserveHost On
	ProxyPass / http://127.0.0.1:9090/
        ProxyPassReverse / http://127.0.0.1:9090/

	ErrorLog ${APACHE_LOG_DIR}/prometheus.sysad.su.error.log
	CustomLog ${APACHE_LOG_DIR}/prometheus.sysad.su.access.log combined

	SSLCertificateFile /etc/letsencrypt/live/prometheus.sysad.su/fullchain.pem
	SSLCertificateKeyFile /etc/letsencrypt/live/prometheus.sysad.su/privkey.pem
	Include /etc/letsencrypt/options-ssl-apache.conf
</VirtualHost>
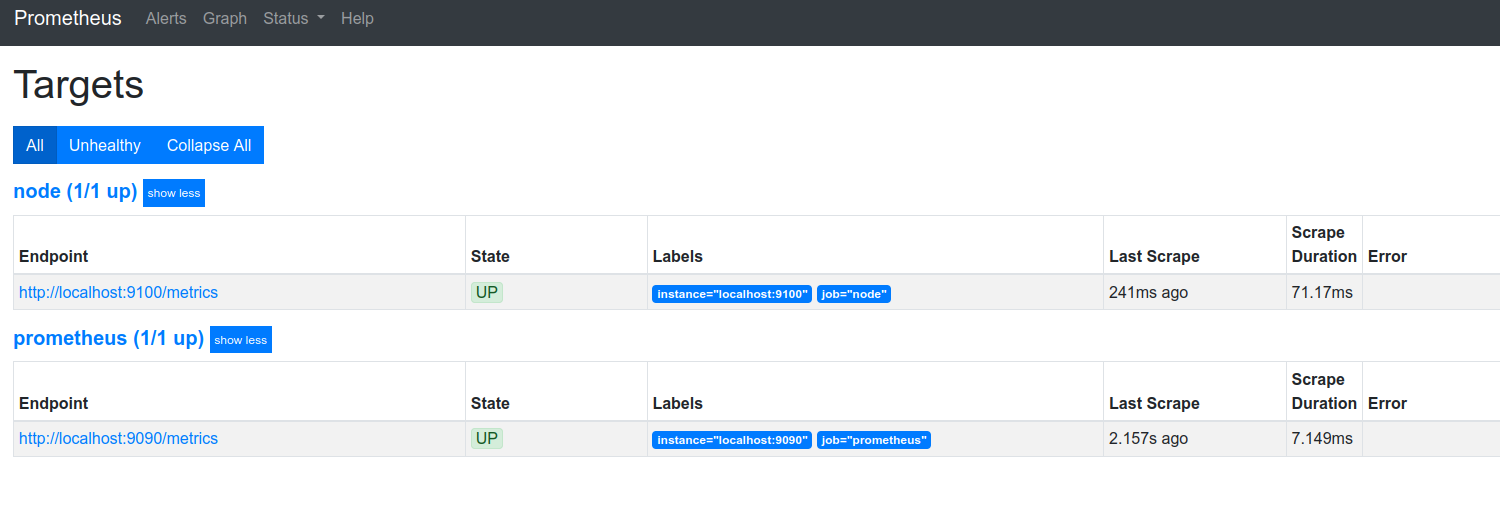
Если всё настроено корректно, то на странице Status->Targets картина должны быть примерно такой:
Добавить комментарий